

- Published on
AI Analysis of Ethereum Supply and Burning: A Practical Guide
Listen to the full article:
- Authors

- Name
- Jagadish V Gaikwad
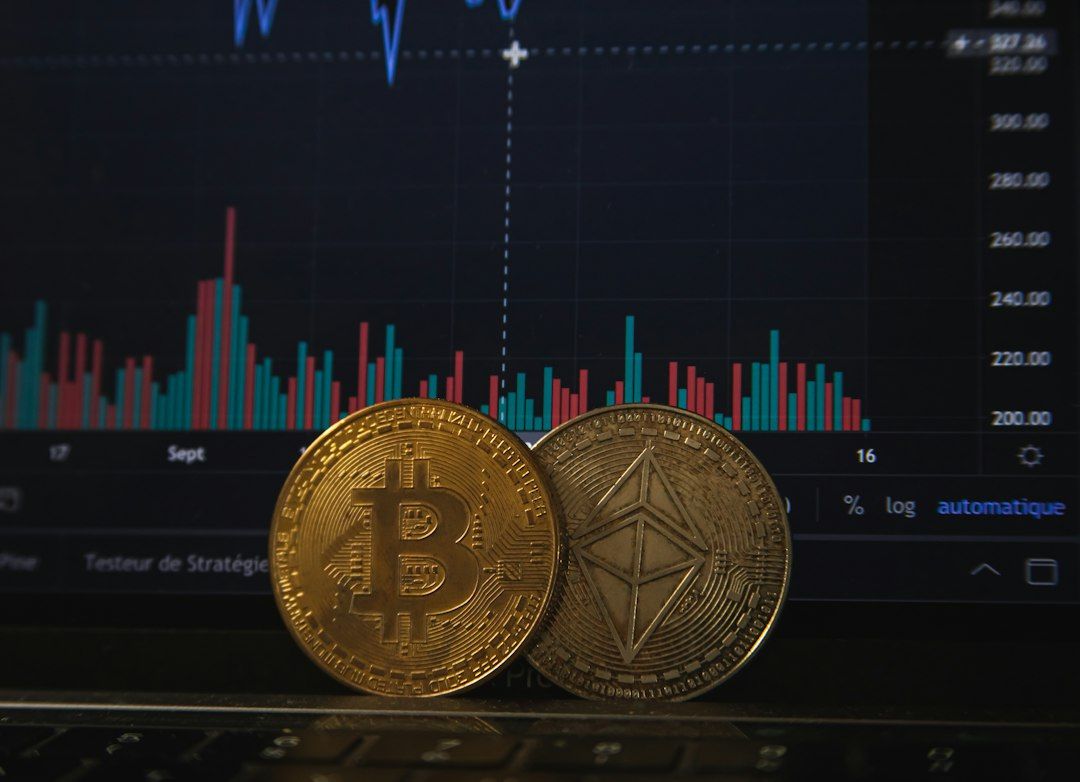
What AI analysis of Ethereum supply and burning means
AI analysis of Ethereum supply and burning uses machine-learning systems, statistical models, and automated data pipelines to study how ETH enters and leaves circulation. The goal is not simply to label Ethereum as “inflationary” or “deflationary,” but to explain the conditions that drive its changing supply.
Ethereum’s supply is dynamic because two major forces operate at the same time:
- Issuance: new ETH is created primarily as rewards for validators securing the proof-of-stake network.
- Burning: some transaction fees are permanently removed from the supply through EIP-1559.
Ethereum’s official documentation describes total supply as the result of these opposing mechanisms rather than a fixed schedule.(https://ethereum.org/what-is-ether/supply/)
A useful plain-language model is:
Net supply change equals newly issued ETH minus burned ETH.
When issuance exceeds burning, supply increases. When burning exceeds issuance, supply decreases. When the two are close, supply is broadly stable over the measured period.
AI can help identify patterns in this balance, compare different time windows, and generate scenarios. It cannot remove the uncertainty created by changing network activity, validator participation, transaction demand, upgrades, or market behavior.
How Ethereum supply changes
Validator issuance
After Ethereum’s transition to proof of stake, validators receive ETH for proposing and attesting to blocks and for performing other protocol duties. The amount issued depends partly on the amount of ETH participating in staking and the protocol’s reward rules.
Ethereum.org explains that post-Merge issuance is substantially lower than the issuance associated with proof of work. Its published overview estimated approximately 1,700 ETH per day under a stated staking assumption and described an approximately 88 percent reduction in total new issuance after the Merge.(https://ethereum.org/roadmap/merge/issuance/)
Those figures should not be treated as permanent current values. Validator participation changes, and protocol parameters or network conditions can affect issuance. An AI model that uses a historical issuance rate without updating its data may produce a confident but outdated conclusion.
EIP-1559 burning
EIP-1559 changed Ethereum’s transaction fee mechanism by separating the base fee from the priority fee. The base fee is burned, while the priority fee is paid to the block proposer. The result is that network demand can remove ETH from circulation.
The EIP-1559 specification describes the base fee as a protocol-determined amount that rises or falls according to block demand and is permanently removed from supply.
Burning is therefore activity-sensitive. A quiet network may burn relatively little ETH even if the protocol is functioning normally. A period of heavy demand can increase the base fee and the amount burned. High fees may also discourage some users, so burning should not be interpreted as a simple measure of network health.
Ethereum’s post-Merge supply explanation notes that daily network activity must produce enough fee burning to offset validator issuance before net supply becomes zero or negative.(https://ethereum.org/roadmap/merge/issuance/)
Blob-related fees and layer-2 activity
Ethereum’s fee market also includes activity associated with data availability for rollups. EIP-4844 introduced temporary data blobs, which are used by layer-2 networks to publish data more efficiently. Blob-related fees can influence the amount of ETH burned, although the size of that effect depends on demand for blob space and the relevant fee market.
This creates an important analytical distinction: Ethereum execution fees and blob fees should not automatically be treated as one identical source of demand. An AI pipeline should track them separately where the data allows it, then evaluate their combined contribution to burning.
What data an AI model should analyze
A serious analysis needs more than a single supply chart. At minimum, the data pipeline should contain:
- ETH issuance by day or block
- ETH burned by day or block
- Total supply at consistent timestamps
- Base fees and priority fees
- Gas used and gas prices
- Validator count and staked ETH
- Layer-2 transaction activity
- Blob usage and blob fees
- Large protocol upgrades
- The time zone and block range used for every calculation
The official Ethereum supply documentation identifies proof-of-stake issuance and EIP-1559 burning as the central supply mechanisms. It also points readers toward supply trackers such as Ultrasound Money for real-time monitoring.(https://ethereum.org/content/what-is-ether/supply/index.md)
Data consistency matters because different dashboards may use different block ranges, update schedules, indexing methods, or definitions of circulating supply. A model can appear precise while comparing a real-time burn estimate with a delayed issuance estimate.
Useful AI tasks
AI is most useful when it performs clearly defined tasks rather than making vague market predictions.
Classification: A model can classify periods as net inflationary, approximately neutral, or net deflationary based on observed issuance and burn data.
Anomaly detection: It can flag unusually large changes in burned ETH, gas usage, validator issuance, or supply measurements.
Time-series forecasting: It can estimate possible future burn or issuance under specified assumptions. This is a forecast, not a fact.
Clustering: It can group network periods by activity patterns, such as low-demand, trading-heavy, NFT-heavy, or rollup-driven usage.
Natural-language explanation: A language model can summarize why supply changed during a selected period, provided the underlying data and calculations are independently checked.
Scenario analysis: A model can estimate how net supply might respond if transaction demand, validator participation, or average fees change.
The strongest workflow separates measurement from interpretation. First calculate what happened. Then identify likely drivers. Only after that should a model produce a forecast or scenario.
A practical framework for analyzing Ethereum burning
A repeatable process can make AI-assisted analysis more reliable.
1. Define the measurement window
Choose whether the analysis covers blocks, days, weeks, or months. Short windows can reveal sudden changes but may be noisy. Longer windows smooth temporary spikes but can hide important events.
Always record the start and end timestamps. “Monthly burn” is ambiguous if one source uses calendar months and another uses rolling 30-day periods.
2. Separate issuance from burning
Do not ask a model to infer net supply from price charts, social-media posts, or a single headline. Use separate time series for newly issued ETH and burned ETH.
Then calculate net supply change in plain language:
Net change = issuance minus burn.
If the result is positive, supply increased over the selected period. If the result is negative, supply decreased. The sign alone does not explain why the result occurred.
3. Add causal variables
Include variables that could plausibly affect burning or issuance:
- Gas used
- Base fee
- Transaction count
- Contract interaction activity
- Validator participation
- Staked ETH
- Blob demand
- Major protocol upgrades
- Layer-2 usage
The model should distinguish correlation from causation. For example, higher fees and higher burn may occur together because both respond to demand. That does not mean burning independently caused the demand.
4. Test multiple time horizons
A daily result may be negative while a quarterly result remains positive. Both statements can be accurate because they describe different windows.
A robust report should show at least one short-term window and one longer-term window. It should also state whether values are absolute ETH amounts, percentages of supply, or annualized estimates.
5. Inspect uncertainty
Forecasts should include assumptions and, where possible, a range of outcomes. A model that predicts one exact burn number without explaining uncertainty is difficult to evaluate.
Useful scenario labels include:
- Low network demand
- Moderate network demand
- High network demand
- Higher validator participation
- Lower validator participation
- Increased blob demand
- Reduced execution-layer activity
These are analytical scenarios, not promises about future Ethereum usage.
Comparing analytical approaches
| Approach | Best use | Main strength | Important limitation |
|---|---|---|---|
| Protocol data and direct accounting | Measuring past issuance and burning | Closest to the underlying mechanism | Requires reliable indexing and consistent timestamps |
| Statistical time-series model | Short- and medium-term forecasting | Can quantify recurring patterns | Performs poorly when demand changes abruptly |
| Machine-learning model | Detecting nonlinear relationships and anomalies | Can combine many variables | May overfit historical conditions |
| Large language model | Explaining data and producing research summaries | Makes technical findings easier to understand | Can invent explanations unless every claim is checked |
| Scenario model | Stress-testing possible outcomes | Makes assumptions explicit | Results depend heavily on chosen assumptions |
The best system is usually hybrid. Direct protocol accounting should establish the facts. Statistical or machine-learning tools can identify patterns. A language model can then explain the results, but its narrative should never replace the underlying calculations.
What AI cannot reliably determine
AI analysis has several hard limits.
It cannot make supply inherently predictable
Ethereum’s burn depends on future demand for block space and related data availability. Those variables respond to market conditions, applications, user behavior, fees, and technical changes. Historical patterns can inform a forecast but cannot guarantee it.
It cannot turn “deflationary” into a permanent label
Ethereum may be net deflationary over one period and net inflationary over another. The correct question is not whether ETH is permanently deflationary. It is whether issuance or burning was larger during a defined window, and what assumptions support a forward-looking estimate.
It cannot infer economic value from burn alone
Burning removes ETH, but a lower supply does not automatically mean a higher market price. Price also reflects demand, liquidity, expectations, risk, competing networks, macroeconomic conditions, and investor behavior.
EIP-1559’s design links burning to the base fee, but the mechanism itself does not guarantee a particular price outcome.(https://eips.ethereum.org/assets/EIP-7378/TR1559.pdf)
It cannot solve bad data
Missing blocks, inconsistent indexing, duplicate records, delayed updates, and mismatched definitions can corrupt a model. A sophisticated algorithm trained on flawed inputs may produce a polished explanation of an incorrect result.
It cannot replace protocol knowledge
A model may mistake validator rewards for transaction fees, confuse total supply with exchange balances, or treat a temporary fee spike as a structural change. Human review is needed to connect the numbers to Ethereum’s actual mechanisms.
How to evaluate an AI-generated Ethereum supply report
Before trusting a report, check five things:
- Source transparency: Does it identify the data provider, block range, timestamps, and definitions?
- Mechanism accuracy: Does it distinguish issuance, base-fee burning, priority fees, and blob-related fees?
- Reproducibility: Can another analyst repeat the calculation from the stated inputs?
- Uncertainty: Does it label forecasts, estimates, and assumptions?
- Event awareness: Does it account for protocol upgrades and unusual demand periods?
A useful report should also show absolute amounts alongside rates. Saying that burn “increased” is incomplete without specifying whether the comparison is daily ETH, annualized supply impact, or a percentage change from a low base.
For financial decision-making, treat AI output as research assistance rather than investment advice. A model can help organize evidence, but it cannot guarantee returns, identify a risk-free trade, or establish that ETH is undervalued.
A simple prompt for responsible AI analysis
A well-structured prompt can reduce unsupported conclusions:
Analyze Ethereum issuance and burned ETH for a specified block or date range. Use separate values for validator issuance, EIP-1559 base-fee burn, and blob-related burn where available. State the data sources, timestamps, missing data, calculation method, and assumptions. Distinguish observed facts from forecasts. Do not infer price direction from supply changes alone.
This type of instruction is better than asking whether Ethereum is “deflationary,” because it forces the analysis to define its terms and show its evidence.
Conclusion
AI analysis of Ethereum supply and burning is most useful as a measurement, explanation, and scenario-building workflow. Ethereum’s supply changes through the interaction of validator issuance and protocol-level fee burning, with the balance shifting as network demand and staking conditions change.(https://ethereum.org/what-is-ether/supply/)
The reliable approach is straightforward: collect consistent protocol data, separate issuance from each burn source, calculate net change over clearly defined periods, test multiple time horizons, and label forecasts as forecasts. AI can reveal patterns and make complex data easier to interpret, but it cannot make Ethereum’s supply path certain or convert token burning into a guaranteed market outcome.
You may also like
- Generative AI in Banking: Use Cases, Risks, and Opportunities
- As iPhone 17 Sales Begin in India: Which iPhone 17 Model Should You Buy?
- AI-Powered Risk Management for Digital Asset Managers: What Actually Works in 2026
- Best SaaS Platforms for Remote Team Collaboration in 2025: Complete Guide
- What’s New in Battery Tech & Fast Charging — What You Can Expect in Phones