

- Published on
AI-Powered Token Holder Analysis: A Practical Guide to Wallet Quality and Risk
Listen to the full article:
- Authors

- Name
- Jagadish V Gaikwad
What Is AI-Powered Token Holder Analysis?
AI-powered token holder analysis is the use of machine learning, statistical methods, and automated blockchain data processing to evaluate who holds a token, how wallets are connected, and what their behavior may imply.
A basic holder list answers only one question: which addresses currently hold the token? A more useful analysis asks additional questions:
- How concentrated is ownership among the largest holders?
- Are several wallets controlled by one person or organization?
- Did early buyers receive funds from a common source?
- Are holders accumulating, distributing, or rapidly trading?
- Which wallets appear to be developers, insiders, snipers, market makers, or long-term participants?
- Are apparent holders actually exchange wallets, liquidity contracts, burn addresses, or vesting contracts?
Modern analytics systems can combine holder balances, transfer histories, wallet labels, funding sources, transaction timing, and relationship graphs. For example, Birdeye documents holder views that can aggregate token accounts into wallet-level ownership and combine holder profiles with distribution, first-buyer, position, and wallet-tag data.
The central idea is simple: holder count is a starting metric, not a measure of holder quality.
AI can make this work faster and more consistent, but it does not reveal private identities or prove intent. Its output is best treated as evidence for further due diligence rather than as an automatic buy or sell signal.
Why Holder Counts Can Mislead
A token may show thousands of holders while a small number of related entities control a substantial share of the circulating supply. Conversely, a token may appear highly concentrated because a centralized exchange or liquidity pool holds tokens on behalf of many users.
This is why ownership analysis needs context. The same percentage can mean very different things depending on the address category.
Consider these common address types:
- Externally owned wallets: Addresses generally controlled by individuals, organizations, bots, or automated strategies.
- Smart contracts: Programs that may represent liquidity pools, staking systems, bridges, vesting schedules, or treasury operations.
- Centralized exchanges: Custodial addresses holding assets for many customers.
- Burn addresses: Addresses designed to make tokens effectively inaccessible.
- Treasury or team wallets: Project-controlled addresses that may affect governance and market supply.
- Market-maker wallets: Operational addresses used to provide liquidity or facilitate trading.
A robust workflow separates these categories before calculating concentration. Treating every address as an independent retail holder can inflate decentralization estimates. Treating every large wallet as an insider can create the opposite error.
Wallet grouping is particularly important on networks where one owner may control multiple token accounts. A holder API may provide both token-account and wallet-grouped views, allowing researchers to distinguish technical account structure from owner-level exposure.
How AI Analyzes Token Holders
AI-powered analysis usually combines several layers of data rather than relying on one model.
1. Holder distribution
The first layer measures how supply is distributed across addresses or wallet groups. Useful measures include:
- The share held by the largest wallet
- The combined share held by the top 10, 20, or 50 holders
- The number of wallets above a selected ownership threshold
- Changes in concentration over time
- The percentage held by contracts, exchanges, treasuries, and known team wallets
These figures describe exposure, not necessarily risk. A large liquidity pool may be operationally necessary, while a large unidentified wallet may deserve closer review.
Distribution should also be examined across time. A token whose top-holder concentration is declining because new wallets are receiving small allocations is different from one where large holders are steadily selling into new demand.
2. Wallet clustering
Wallet clustering attempts to identify addresses that may be related. Systems can compare:
- Common funding sources
- Transfers between wallets
- Similar transaction timing
- Repeated co-trading
- Shared interaction with contracts
- Consolidation of assets into a common destination
- Similar trading and holding behavior
Some analytics documentation describes cluster signals such as multiple wallets funded by the same source, purchases in the same transaction, identical timing, similar amounts, and later consolidation.
A cluster is not proof of common ownership. Exchanges, trading services, airdrop distributors, and automated infrastructure can create legitimate relationships between wallets. The correct interpretation is that the addresses share observable connections and warrant classification.
3. Behavioral labeling
Machine-learning systems may assign labels such as developer, sniper, insider, trader, market maker, long-term holder, or suspected bot. These labels are derived from transaction behavior and known address relationships.
For instance, a wallet that buys immediately after launch, sells rapidly, and repeats the pattern across many tokens may receive a short-term trader or sniper classification. A wallet that receives tokens from a deployer-linked address may receive an insider-related flag.
Labels are useful summaries, but they are not facts about identity. A label should be accompanied by the evidence behind it:
- Which transactions triggered the label?
- What time period was analyzed?
- Is the label based on a direct known relationship or a behavioral similarity?
- How often does the system update its classification?
- Can a user inspect the underlying addresses and transfers?
A vendor’s score without an explanation is difficult to audit and should not be treated as decisive.
4. Cohort and flow analysis
AI can group holders by when they acquired tokens or how they behave after acquisition. Common cohorts include:
- First buyers
- Buyers from a launch window
- Recent accumulators
- Dormant holders
- Wallets that sold after a price increase
- Holders that remain after major volatility
Flow analysis then tracks whether cohorts are accumulating, distributing, or moving tokens to related addresses.
This helps distinguish organic growth from temporary wallet inflation. A rising holder count with little meaningful retained balance may indicate low-value distribution, automated activity, or fragmented ownership. It may also simply reflect a token used for many small transactions. The surrounding evidence matters.
What AI Can Detect
AI-powered token holder analysis is most valuable when it exposes relationships that are difficult to inspect manually.
Potential findings include:
- A group of wallets funded by one upstream address
- Multiple early buyers acting within the same narrow time window
- Repeated coordinated purchases across several tokens
- Tokens moving from several wallets into one destination
- A project-controlled wallet distributing supply across related addresses
- A sharp increase in holders without corresponding retained balances
- Large holders quietly reducing exposure over several transactions
- A concentration change caused by a contract migration rather than genuine selling
Cross-token analysis can be especially informative. Some specialized services compare holders across multiple tokens to surface wallets that repeatedly appear in the same projects or trading groups.
However, detection is not attribution. On-chain data can show that wallets interact, but usually cannot establish the legal identity of the person behind them. It can also miss relationships that occur through centralized platforms, privacy tools, bridges, or off-chain agreements.
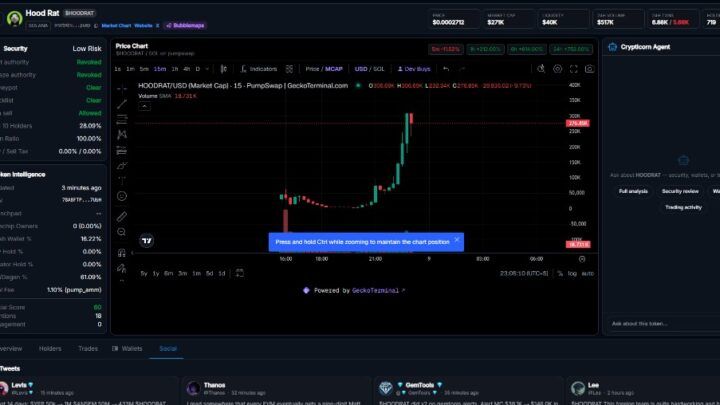
A Practical Workflow for AI-Powered Token Holder Analysis
A repeatable process reduces the risk of overreacting to a single metric.
Step 1: Identify the token and chain
Confirm the contract address, network, token decimals, trading pairs, and whether the asset has undergone a migration. Never rely on a symbol alone because unrelated tokens can share the same name or ticker.
Step 2: Build a categorized holder snapshot
Retrieve the current holders and group them by wallet where the data source supports owner-level aggregation. Exclude or separately classify known liquidity pools, exchanges, burn addresses, bridges, staking contracts, and treasury wallets.
Record the timestamp because holder balances change continuously.
Step 3: Measure concentration
Calculate top-holder shares using both raw addresses and categorized wallet groups. Compare the current snapshot with earlier snapshots when available.
The interpretation should answer:
- Is ownership concentrated in identifiable operational contracts?
- Is concentration held by unknown or connected wallets?
- Are large holders gaining or losing exposure?
- Does the circulating supply definition exclude locked or inaccessible tokens?
Step 4: Investigate the largest and most active wallets
Inspect funding sources, acquisition dates, transfer paths, realized or unrealized trading behavior where available, and interactions with project-controlled addresses.
Do not assume that a profitable early wallet is an insider. Early access can result from public launch participation, automated trading, market making, or chance.
Step 5: Run cluster and cohort checks
Use automated clustering to identify common funders, synchronized transactions, recurring co-trading, and wallet consolidation. Then review the highest-risk clusters manually.
The strongest workflow combines several independent signals. A common funder alone may be harmless. A common funder combined with synchronized buying, similar amounts, repeated cross-token activity, and later consolidation is more concerning.
Step 6: Separate evidence from inference
Create two columns in the research record:
- Observed: Wallet A received funds from Wallet B, bought during the launch block, and transferred tokens to Wallet C.
- Inferred: Wallets A and C may be controlled by the same entity.
This distinction prevents automated scores from becoming unsupported accusations.
Step 7: Monitor changes
A single snapshot cannot reveal whether a holder is accumulating or distributing. Set review intervals appropriate to the token’s activity and compare:
- Top-holder concentration
- Net flows by cohort
- New wallet quality
- Exchange and liquidity-pool balances
- Cluster activity
- Team and treasury transfers
Comparing Analysis Approaches
| Approach | Best use | Main strength | Main limitation |
|---|---|---|---|
| Manual explorer review | Small tokens and one-off checks | Transparent transaction-level evidence | Slow and difficult to scale |
| Holder distribution dashboard | Initial concentration review | Quickly shows ownership structure | May not identify related wallets |
| Wallet clustering model | Sybil and coordination investigation | Surfaces hidden relationships | Connections can have legitimate explanations |
| Cohort and flow analysis | Launch and post-launch monitoring | Shows who is buying or selling over time | Requires reliable historical data |
| AI-assisted investigation | Large holder sets and repeated monitoring | Prioritizes unusual patterns efficiently | Scores can be opaque, incomplete, or wrong |
The best approach is usually layered: use dashboards for discovery, automated models for prioritization, and transaction-level review for verification.
Limitations and Risks
False positives
Shared infrastructure can make unrelated wallets look connected. An exchange, trading desk, airdrop service, or market-making firm may fund many addresses from common operational wallets.
False negatives
A careful actor can distribute activity across funding paths, use intermediaries, trade through centralized venues, or avoid obvious timing patterns. No public-data model can guarantee complete detection.
Incomplete labels
Address labels depend on the provider’s data, methodology, and update schedule. Two services may classify the same wallet differently.
Chain-specific blind spots
A method designed for one blockchain may not transfer cleanly to another. Account models, transaction structure, token standards, bridges, and contract behavior differ across networks.
Model and vendor risk
An AI score may be trained on historical patterns that do not represent new market behavior. Vendor documentation should explain data coverage, update frequency, confidence levels, and the meaning of each score.
Privacy and compliance concerns
Wallet analysis uses public ledger data, but combining it with off-chain identity information creates additional privacy and legal considerations. Researchers should avoid publishing unnecessary personal information or presenting probabilistic wallet links as confirmed identities.
How to Evaluate an AI Token Analysis Tool
Before relying on a platform, ask:
- Which chains and token standards does it support?
- Does it aggregate token accounts into wallet-level ownership?
- How does it classify exchanges, liquidity pools, bridges, and burn addresses?
- Can it show the transactions behind a wallet label?
- Does it expose confidence or uncertainty?
- How frequently are balances and labels refreshed?
- Can it distinguish observed facts from model-generated inferences?
- Does it document its clustering methodology?
- Can results be exported for independent review?
- What happens when a wallet has limited history?
A useful tool should make investigation easier without hiding the reasoning. A polished risk score is less valuable than an auditable trail from score to wallet, transaction, and explanation.
A Hypothetical Example
Suppose a token has 12,000 displayed holders. An automated review finds that the largest liquidity pool and a centralized exchange account explain much of the apparent concentration. That reduces one concern, but the remaining analysis identifies 18 early wallets funded by two common sources.
The wallets also purchased within a narrow launch window and later transferred portions of their holdings to three related destinations. This is not proof that one entity controlled all 18 wallets. It is a strong reason to examine the funding paths, project disclosures, unlock schedule, and current balances before treating the holder count as evidence of broad distribution.
The correct conclusion is not “the token is fraudulent.” It is “the ownership structure contains an unresolved coordination signal.”
That wording matters because analysis should support proportionate decisions, not manufacture certainty.
Conclusion
AI-powered token holder analysis turns a static address list into a broader investigation of ownership concentration, wallet relationships, trading behavior, and supply movement. Its greatest value is prioritization: it helps researchers find patterns that would be slow to identify manually.
The safest workflow combines categorized holder data, concentration measurements, wallet clustering, cohort analysis, and transaction-level verification. Treat model labels as hypotheses, not identity proofs, and treat risk scores as inputs rather than verdicts.
A high holder count can be encouraging, but it is not enough. The more useful question is whether the holder base appears diverse, persistent, and independently controlled after operational wallets and related addresses are properly accounted for.

You may also like
- Ubisoft
- How AI Detects Unusual Wallet Activity
- MCP Servers Explained for Developers: The Ultimate Guide to Model Context Protocol
- AI Integration Strategies for Existing SaaS Businesses: A Practical Guide for 2025
- Jude Bellingham Saves England vs Norway in FIFA Quarterfinals: The Extra-Time Heroics That Delivered a Semifinal Spot