

- Published on
How AI Detects Crypto Exchange Price Dislocations
Listen to the full article:
- Authors

- Name
- Jagadish V Gaikwad
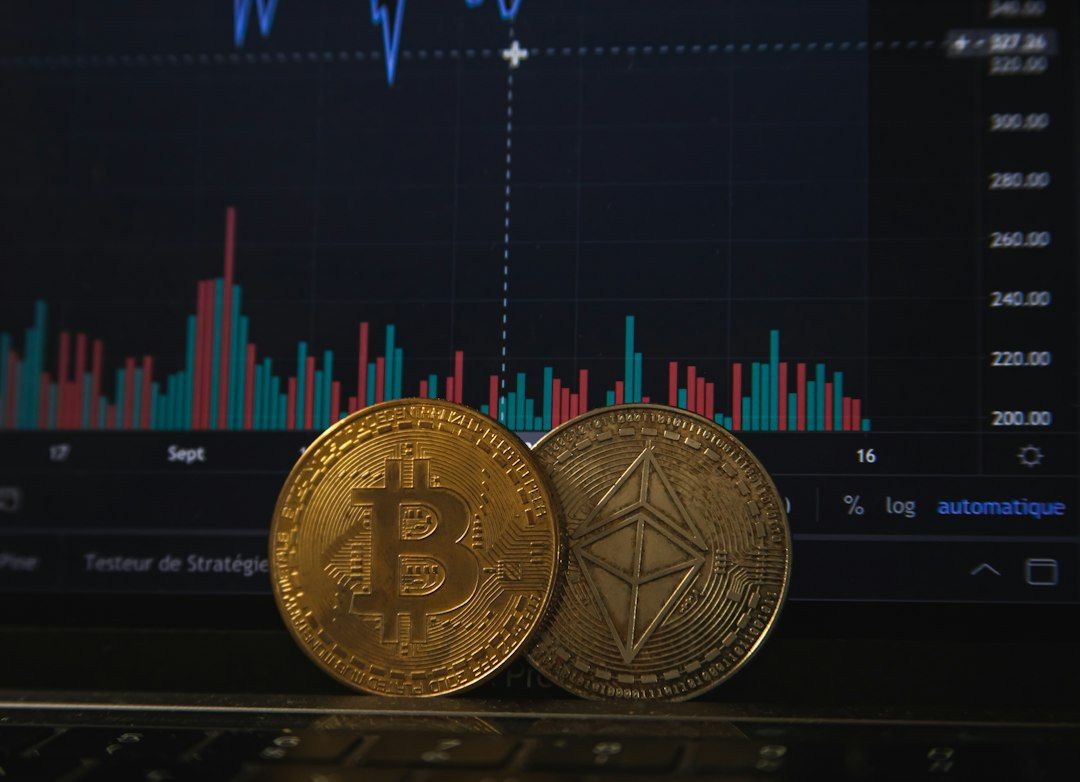
Crypto exchange prices can diverge even when exchanges list the same asset. A Bitcoin price on one venue may temporarily exceed the executable price on another because liquidity is fragmented, order books update at different speeds, currencies and stablecoins differ, or transfers and settlement are constrained.
AI detects these price dislocations by combining real-time market data, statistical baselines, order-book analysis, and execution-risk checks. It does not simply compare two headline prices. A useful system must determine whether the difference is executable, large enough to survive costs, and likely to persist long enough for a trade to complete.
Research on cryptocurrency markets has documented recurring cross-exchange price deviations, particularly between exchanges in different countries. The observed differences are associated with market segmentation, trading costs, capital controls, and limits on moving funds between venues.Trading and Arbitrage in Cryptocurrency Markets
What is a crypto exchange price dislocation?
A price dislocation is a meaningful difference between the prices of the same asset or economically equivalent assets in connected markets. In crypto, the comparison might involve:
- The best available buy and sell prices for BTC on two centralized exchanges.
- The price of an asset quoted in different fiat currencies.
- A centralized exchange price compared with a decentralized exchange pool.
- A spot price compared with a related perpetual futures price.
- Prices across venues after adjusting for stablecoin, funding, and settlement differences.
The word dislocation matters because not every difference is an arbitrage opportunity. A displayed price may represent only a small order, while the rest of the order book is much less favorable. One exchange may also have disabled withdrawals, imposed regional restrictions, or lack sufficient balances for the intended trade.
A simple headline spread can therefore be misleading:
- Exchange A displays a BTC ask at 60,000.
- Exchange B displays a BTC bid at 60,300.
- The apparent difference is 300 before fees and other costs.
That observation says little about whether a trader can actually buy and sell the required quantity at those prices. AI systems improve the analysis by replacing static quotes with synchronized, executable market states.
Why prices diverge across exchanges
Crypto markets are fragmented. Each exchange has its own users, market makers, fee schedule, matching engine, technical infrastructure, custody arrangements, and access rules. The research paper Trading and Arbitrage in Cryptocurrency Markets reports that cross-exchange deviations can be large and recurring, with larger spreads between exchanges in different countries than between venues in the same country.Trading and Arbitrage in Cryptocurrency Markets
Several mechanisms can create or extend a dislocation:
- Different liquidity pools: A large order can move the price more on a thin venue than on a deep venue.
- Latency: One exchange may update its book before another.
- Capital frictions: Moving cash or crypto between countries, banks, and custodians can take time.
- Withdrawal restrictions: A transfer route may be unavailable during the exact period when prices diverge.
- Stablecoin basis: USDT, USDC, and fiat markets can trade at different effective values.
- Market stress: Liquidations and sudden order imbalance can produce temporary gaps.
- Operational risk: An exchange may experience outages, delayed data, or a malfunctioning market.
Academic research has also linked crypto-market price formation to fragmentation and cross-market interactions rather than to one perfectly unified global order book.Fragmentation, Price Formation, and Cross-Impact in Bitcoin Markets
How AI detects the initial signal
An AI detection system usually follows a pipeline rather than one model. The pipeline turns exchange data into a continuously updated estimate of whether a price difference is unusual and tradable.
1. Collect synchronized market data
The system gathers:
- Best bids and asks.
- Order-book depth.
- Executed trades.
- Trading volume.
- Timestamps and sequence numbers.
- Deposit and withdrawal status.
- Exchange fees.
- Funding rates for derivatives.
- Exchange and asset metadata.
- Reference prices for fiat and stablecoins.
Real-time WebSocket feeds are important because polling REST endpoints can miss short-lived changes. Kraken's documentation describes order-book feeds that provide an initial snapshot followed by level updates, while its more granular level-three feed can support queue-priority and order-book analytics.Kraken Spot WebSocket documentation Kraken order-book API documentation
The data must then be normalized. Exchanges may use different symbol names, decimal precision, timestamp conventions, and definitions of volume. A robust system maps them to a common asset, quote currency, quantity unit, and clock.
2. Build a fair reference price
The model needs a benchmark against which each exchange can be compared. A basic reference may be a volume-weighted median of prices from liquid venues. A more advanced reference can weight each venue by:
- Recent reliable volume.
- Order-book depth.
- Bid-ask spread.
- Data quality.
- Historical responsiveness.
- Availability of deposits and withdrawals.
The purpose is not to declare one exchange correct. It is to estimate the price that best represents the immediately accessible market after excluding stale or unreliable observations.
AI can learn normal relationships between venues. For example, it may observe that one exchange usually trades a few basis points above another because of fees, local currency demand, or a persistent stablecoin premium. A deviation from that normal relationship is more informative than a raw difference from zero.
3. Detect unusual deviations
The system can compare the current spread with its historical distribution. Useful features include:
- The size of the spread.
- How many standard deviations it is from its recent norm.
- How long the deviation has persisted.
- Whether it is widening or narrowing.
- Whether trade volume confirms the move.
- Whether multiple venues show the same directional change.
- Whether the difference appears at several order-book levels.
Machine-learning models may classify market states such as normal, stressed, illiquid, stale-data, or potentially executable. The model does not need to predict the future perfectly. Its first job is to rank alerts by quality and suppress ordinary differences.
A short-lived price gap with no depth may be less useful than a smaller gap supported by substantial executable liquidity.

Why order-book depth matters more than displayed price
The best bid and ask represent only the first available level. If a strategy needs to trade 100,000 dollars of an asset, it may consume several levels and receive an average execution price that is materially worse than the top quote.
AI systems therefore simulate execution through the book. They estimate:
- The volume available at each price level.
- The expected average fill price.
- Slippage caused by the intended order size.
- The probability that the book changes before execution.
- The effect of placing a limit order instead of taking liquidity.
This changes the question from “Is Exchange A cheaper?” to “Can the strategy acquire the target quantity on Exchange A and sell it on Exchange B at a net positive result?”
Estimated net return can be described in plain language as:
gross price difference minus trading fees minus slippage minus transfer and financing costs minus expected execution losses.
The calculation should be performed for the actual order size, not for a nominal one-unit quote.
How AI filters false opportunities
Many apparent dislocations are data or market-structure artifacts. An effective model checks them before producing an actionable alert.
| Apparent opportunity | Why it may be false or unattractive | Useful AI validation |
|---|---|---|
| Large difference between top quotes | Only a tiny quantity is available | Simulate fills across book depth |
| Price gap appears after one feed stops updating | One quote is stale | Compare timestamps, sequence numbers, and trade activity |
| Spread disappears during order submission | Market moves faster than execution | Estimate latency and quote survival |
| Buy on one venue and sell on another | Funds cannot be transferred in time | Check wallet, network, and withdrawal status |
| Gross spread exceeds visible fees | Slippage, funding, or currency basis consumes it | Calculate all-in net return |
A model can assign a confidence score based on agreement among independent signals. For example, an alert becomes more credible when the spread appears in both order-book quotes and recent trades, persists across several updates, and remains positive after simulated costs.
By contrast, confidence should fall when one exchange reports unusual volume, timestamps are delayed, the order book is extremely thin, or withdrawals are suspended.
Feature engineering for crypto dislocation detection
“AI” is not a single technique. Different models solve different parts of the problem.
Statistical anomaly detection
Rolling medians, volatility-adjusted thresholds, and change-point detection can identify observations that depart from recent behavior. These methods are often easier to audit than complex neural networks and can work well when the relationships are stable.
Classification models
A classifier can estimate whether an observed gap belongs to categories such as:
- Executable opportunity.
- Stale quote.
- Temporary liquidity shock.
- Persistent market segmentation.
- Operational anomaly.
- High-risk exchange condition.
Training labels may come from simulated or realized execution outcomes, but historical labels can be noisy. A spread that looked executable in a backtest may not have been fillable in live trading.
Time-series models
Time-series models estimate whether a dislocation is likely to close, widen, or persist. Features can include order-flow imbalance, volatility, recent returns, trade intensity, and the relative speed at which venues respond to market moves.
A forecast of convergence is not proof that convergence will occur. Some spreads persist because capital cannot move freely or because the venues serve different participant groups.
Unsupervised clustering
Clustering can group exchanges or market states by behavior. One cluster may contain deep global venues, another regional fiat markets, and another thin or irregular markets. This helps the system avoid treating structurally different prices as if they were interchangeable.
Data quality is part of the model
A sophisticated model cannot repair unreliable inputs automatically. Crypto exchange feeds can contain gaps, duplicate messages, out-of-order updates, clock differences, and temporary outages.
Before using an alert, the system should verify:
- The local order book is synchronized with the exchange snapshot.
- Update sequence numbers are continuous where provided.
- Timestamps are converted to a common clock.
- The asset and quote currency are correctly mapped.
- The quote is recent enough for the strategy's latency.
- The exchange has not changed its trading rules.
- The apparent volume is consistent with executed trades.
Kraken's API guidance emphasizes maintaining a local order book from snapshots and updates, which illustrates why feed interpretation is a technical requirement rather than a cosmetic detail.Kraken WebSocket API FAQ
An alert based on a stale book is not a weak trading signal. It is a data-integrity failure.

Real-time detection versus backtesting
Backtests can show that price differences existed historically, but they may overstate what a live system could capture. Common sources of backtest bias include:
- Using prices that were not available at the same time.
- Assuming every displayed quote could be filled.
- Ignoring partial fills.
- Omitting exchange and withdrawal fees.
- Assuming instant transfers.
- Excluding downtime and rejected orders.
- Using survivorship-biased exchange lists.
- Treating an opportunity as independent when many traders were observing it.
Research on crypto arbitrage has found significant historical deviations but also emphasizes market segmentation and practical constraints.Trading and Arbitrage in Cryptocurrency Markets A credible evaluation should therefore compare predicted opportunities with executable outcomes and include realistic latency, capacity, and failure assumptions.
The risks AI cannot eliminate
Detection is not execution, and execution is not settlement. A high-confidence model can still produce a losing trade.
Execution risk
Prices can change between detection, order submission, matching, and confirmation. A strategy that buys first and sells later carries directional exposure during that interval.
Transfer and settlement risk
Moving assets between exchanges can take longer than the price gap remains open. Network congestion, wallet maintenance, compliance review, and withdrawal limits can change the economics.
Counterparty risk
Funds held on an exchange are exposed to that platform's operational, legal, and solvency risks. An apparent premium may partly compensate traders for perceived venue risk rather than represent a risk-free inefficiency.
Model risk
A model trained on calm markets may fail during liquidation cascades, exchange outages, or regulatory changes. It can also learn artifacts that disappear after market participants adapt.
Adversarial behavior
Other traders may place and cancel orders, spoof apparent depth, or deliberately create misleading conditions. Order-book presence is not the same as guaranteed liquidity.
These risks explain why price dislocation detection should be treated as a decision-support and risk-control problem, not merely an opportunity scanner.
A practical evaluation checklist
When assessing an AI system for this use case, ask:
- Does it use executable bid and ask prices rather than last-traded prices?
- Does it model the intended order size?
- Does it include fees, slippage, funding, and transfer costs?
- Does it detect stale and missing data?
- Does it verify deposit and withdrawal availability?
- Does it measure alert-to-order latency?
- Does it record partial fills and rejected orders?
- Does it distinguish persistent regional premiums from temporary anomalies?
- Does it report uncertainty and confidence degradation?
- Can an operator inspect why an alert was generated?
A transparent system with fewer alerts may be more useful than a black box that produces impressive backtest charts.
Conclusion
AI detects crypto exchange price dislocations by building a synchronized view of fragmented markets, learning normal price relationships, identifying unusual deviations, and testing whether the difference survives order-book depth and real-world costs.
The strongest systems do not ask only whether two exchanges display different prices. They ask whether the quotes are fresh, the liquidity is real, the trade can be executed on both sides, and the settlement path is available. Academic evidence supports the existence of recurring cross-exchange deviations, but those deviations can reflect structural segmentation and operational friction rather than easy profits.Trading and Arbitrage in Cryptocurrency Markets
For that reason, the most valuable role of AI is often not predicting a guaranteed convergence. It is ranking market differences, exposing hidden costs, rejecting unreliable signals, and making the uncertainty visible before capital is committed.

You may also like
- Perplexity AI Caught Red-Handed: The Data Scraping Scandal
- AI in Wealth Management: Benefits, Risks, and Future Trends
- IFA 2025: The Rise of AI-Powered Laptops and Handhelds Revolutionizing Mobile Computing
- End of Windows 10 Support: How It Impacts Gaming PCs and What You Should Do
- AI-Driven HR Management Software Trends 2025: The Future of Workforce Intelligence