

- Published on
How AI Detects Crypto Liquidity Gaps
Listen to the full article:
- Authors

- Name
- Jagadish V Gaikwad
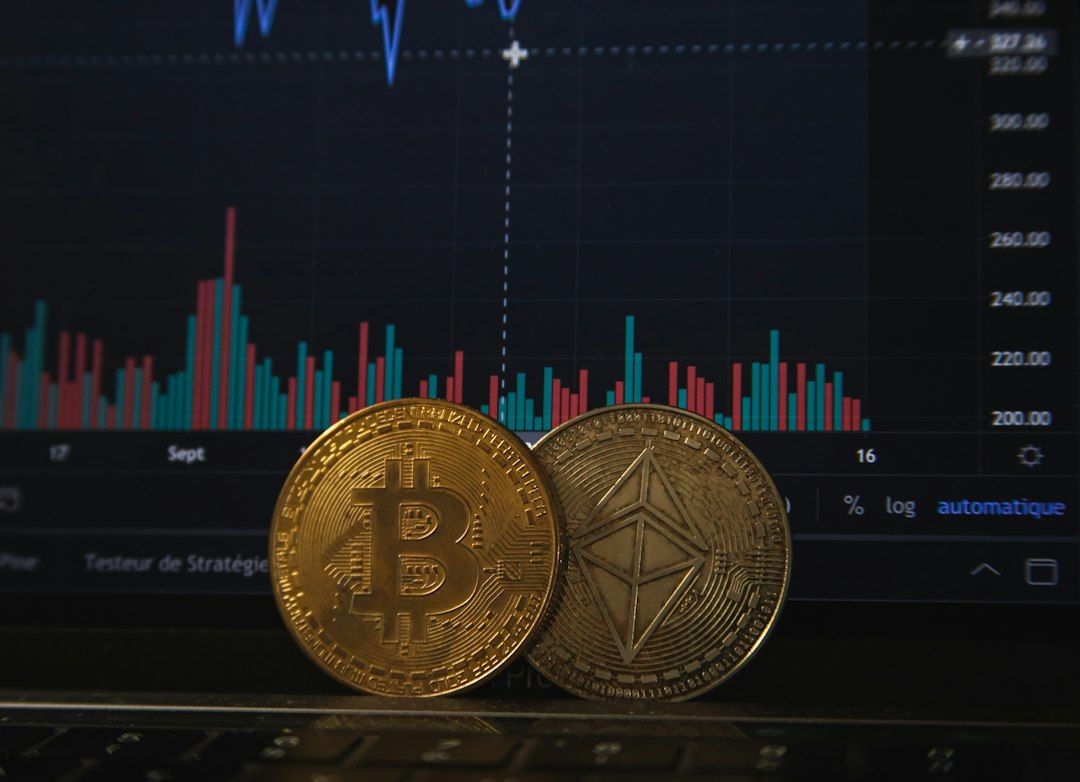
Crypto liquidity gaps are areas where relatively little buying or selling capacity exists near the current market price. When a large order reaches one of these gaps, the price can move sharply because there are not enough opposing orders to absorb it.
How AI detects crypto liquidity gaps is primarily a data and pattern-recognition problem. Models examine order-book depth, bid-ask spreads, trading volume, slippage, transaction timing, volatility, and sometimes on-chain liquidity. They then compare current conditions with historical patterns to flag locations where a trade could cause unusually large price movement.
AI does not eliminate liquidity risk or predict every market disruption. It produces signals that still require validation, execution controls, and an understanding of how the underlying exchange or protocol works.
What a crypto liquidity gap is
A crypto market is liquid when participants can buy or sell meaningful amounts without moving the price substantially. Liquidity is not the same as trading volume. An asset may report high volume while having thin liquidity at a particular price level or on a particular venue.
Several measurements help describe liquidity:
- Bid-ask spread: The difference between the highest current buy offer and the lowest current sell offer.
- Market depth: The value of buy and sell orders available within a specified distance of the current price.
- Slippage: The difference between the expected execution price and the actual average execution price.
- Order-book imbalance: The relative difference between buying interest and selling interest.
- Turnover: How frequently an asset changes hands over a period.
S&P Global identifies market volume, bid-ask spreads, market depth, and slippage as important components of digital-asset liquidity analysis. The European Securities and Markets Authority has also used order-book depth and bid-ask spreads to assess crypto-asset market structure.
A liquidity gap appears when available orders become unusually sparse. For example, a token may have substantial buy orders close to its current price, followed by a large empty range before the next meaningful layer of orders. A market sell order entering that range can consume the nearby bids and move the quoted price toward the next available cluster.
Gaps can occur on either side of the market:
- A downside gap contains weak or sparse bids below the current price.
- An upside gap contains weak or sparse offers above the current price.
- A temporary gap results from cancellations, a market-data delay, or a short-lived burst of volatility.
- A structural gap persists because the asset has limited participation, fragmented liquidity, or insufficient market-making activity.
The key question is not simply whether an empty price range exists. It is whether the gap is large enough, persistent enough, and exposed to enough trading activity to affect execution.
The data AI examines
AI systems usually combine several data categories rather than relying on one indicator.
1. Order-book snapshots
A limit order book records resting buy and sell orders at different prices. A model can transform each snapshot into features such as:
- Total bids and asks within several price bands
- Distance from the midpoint to the nearest large order
- Number of empty price levels
- Concentration of orders at individual levels
- Changes in depth between consecutive snapshots
- Ratio of buy-side depth to sell-side depth
- Rate of order additions and cancellations
A simple rule might flag a gap when depth falls below a chosen threshold across a price interval. Machine-learning models can go further by learning combinations of features associated with later price impact.
The interval matters. A gap that is significant for a small retail trade may be irrelevant to an institutional order. For that reason, useful systems evaluate depth at several potential trade sizes rather than describing a market as simply liquid or illiquid.
2. Spread and execution data
A widening spread often indicates that liquidity providers are demanding more compensation for adverse-selection risk or uncertainty. A model can monitor whether the spread is:
- Wider than its recent baseline
- Widening simultaneously across multiple venues
- Expanding during a sudden volatility event
- Accompanied by declining depth
- Producing higher realized slippage
Spread alone is not proof of a liquidity gap. A market can have a moderately wide spread but substantial depth behind the best quotes. Conversely, a narrow spread can coexist with very little size available at those quotes.
3. Trades and market impact
Executed trades reveal whether displayed liquidity is actually usable. AI systems can compare the size and direction of trades with subsequent price movement.
If relatively small market orders repeatedly cause large price changes, the visible order book may be fragile. If large trades execute with limited movement, the market may have stronger effective liquidity than its displayed depth suggests.
Models may estimate:
- Price movement after a trade
- Slippage at different order sizes
- Recovery time after a large order
- Whether price impact is temporary or persistent
- Whether aggressive buyers or sellers are dominating
This helps distinguish a visual gap from a gap that materially affects execution.
4. Volatility and market regime
Liquidity conditions change with the market regime. A book that appears healthy during quiet trading may thin rapidly during a sharp move, liquidation cascade, exchange outage, or major announcement.
A model therefore includes features such as:
- Short-term and longer-term volatility
- Trading-volume acceleration
- Correlation with major assets
- Funding-rate changes in derivatives markets
- Liquidation activity
- Sudden divergence between venues
The purpose is to identify when a normal-looking gap becomes dangerous because market participants are simultaneously trying to exit or enter.

How machine learning identifies unusual gaps
There is no single AI technique used for every liquidity-monitoring system. The appropriate method depends on the available data, the desired response time, and whether labeled examples exist.
Supervised classification
In supervised learning, historical observations receive labels such as:
- Normal liquidity
- Elevated liquidity risk
- Large expected slippage
- Imminent depth deterioration
- Confirmed market-impact event
A model learns relationships between the input features and those labels. Logistic regression, random forests, gradient-boosting models, and neural networks can all be used.
The label must be defined carefully. “Liquidity gap” could mean an empty order-book interval, a percentage move caused by a trade, a slippage threshold being exceeded, or a sudden withdrawal of pool liquidity. These are related but different events.
A model trained to forecast high slippage should not automatically be presented as a model that predicts a liquidity crisis.
Unsupervised anomaly detection
In many markets, confirmed examples of dangerous gaps are limited. Unsupervised methods instead learn what typical conditions look like and flag deviations.
Potential anomalies include:
- An unusually large drop in depth
- A sudden increase in cancellations
- A long period without new orders
- Abnormal order concentration
- A spread that widens far beyond its normal range
- A depth imbalance that appears across several snapshots
A 2025 comparative study of cryptocurrency limit-order-book anomaly detection evaluated statistical and machine-learning approaches for identifying unusual book behavior. Its discussion illustrates why timing, order arrivals, and order-book structure can all matter when detecting abnormal conditions.
Anomaly detection is useful for alerts, but an anomaly is not automatically a trading opportunity or proof of manipulation. It may reflect a legitimate market repricing, a technical problem, or a temporary data-quality issue.
Time-series models
Liquidity gaps evolve over time. Time-series models examine sequences rather than isolated snapshots. They can learn whether a decline in depth is accelerating, stabilizing, or recovering.
For example, a monitoring system may assign more significance to:
- A small depth decline that continues for several minutes.
- A spread widening that occurs on multiple exchanges.
- Repeated bid cancellations followed by aggressive selling.
- A gap that remains after volatility has returned to normal.
Sequence models can capture these patterns, but they also introduce additional risks. Market behavior changes, data timestamps may be misaligned, and a model trained on one market regime may fail in another.
Clustering and regime detection
Clustering groups observations with similar characteristics. A system may discover separate regimes for:
- Quiet, deep markets
- High-volume but unstable markets
- Thin overnight markets
- News-driven volatility
- Rapidly deteriorating liquidity
The model can then compare the current market with the most relevant historical regime instead of using one fixed threshold for every situation.
DeFi liquidity requires different signals
Centralized-exchange order books are only part of the crypto liquidity landscape. Decentralized exchanges often use automated market makers, in which trades interact with liquidity pools rather than matching directly with visible bids and asks.
In that setting, AI can monitor:
- Pool reserves
- Liquidity-provider withdrawals
- Trading volume relative to pool size
- Price impact for a proposed swap
- Concentrated-liquidity ranges
- Reserve changes across blocks
- Differences between pool prices and external reference prices
- Transaction ordering and failed swaps
A pool can appear large in total value while having little active liquidity near the current price. Concentrated-liquidity designs make this especially important because liquidity providers may place funds only within selected price ranges.
On-chain data also introduces oracle risk. Oracles supply external or derived data to smart contracts, and inaccurate or manipulated inputs can trigger inappropriate liquidations or trades. A BIS bulletin describes the need for multiple data sources, cross-checking, and stronger validation mechanisms when designing oracle systems.
AI can identify suspicious price or liquidity behavior, but it cannot repair a flawed oracle, reverse an executed transaction, or guarantee that a smart contract will respond safely.
One comparison that matters: detection approach versus use case
| Approach | Main data | Best use | Key limitation |
|---|---|---|---|
| Rule-based thresholds | Spread, depth, slippage | Fast alerts and basic safeguards | Can miss complex patterns and create false alarms |
| Supervised classification | Labeled order-book and trade outcomes | Estimating predefined risk categories | Depends on accurate, representative labels |
| Unsupervised anomaly detection | Order-book and transaction behavior | Finding unusual liquidity deterioration | Anomalies need human or system-level interpretation |
| Time-series modeling | Sequential depth, trades, and volatility | Detecting acceleration or persistence | Sensitive to regime changes and timestamp quality |
| DeFi monitoring models | Pool reserves, swaps, ranges, and oracle inputs | Assessing pool-specific execution and protocol risk | On-chain visibility does not remove contract or oracle risk |
No approach is universally superior. A practical system often combines fast rules for immediate protection with statistical or machine-learning models for context.

A practical detection workflow
A reliable liquidity-gap monitor usually follows a pipeline with several stages.
Collect and normalize data
The system gathers order-book updates, trades, candles, derivatives data, and on-chain events. It must normalize price precision, quantity units, timestamps, exchange identifiers, and symbol names.
Without normalization, a model may interpret a unit mismatch or delayed feed as a market signal.
Build features at multiple horizons
Features should cover both the immediate state and recent change. Examples include current depth, depth change over several intervals, spread percentile, cancellation rate, realized slippage, and volatility-adjusted price movement.
The same feature can have different meanings in different assets. A depth value that is healthy for a major asset may be substantial for a small token.
Score and confirm
The model produces a score or classification. The system can require confirmation from independent signals before escalating an alert.
For instance, a warning may become more credible when:
- The order-book gap persists across several updates.
- Executed trades show increasing price impact.
- Multiple venues show similar deterioration.
- Volatility and cancellations rise together.
- On-chain pool depth declines at the same time.
Apply execution controls
Detection is useful only if connected to a response. Controls may include:
- Reducing order size
- Splitting an order into smaller intervals
- Using limit-price boundaries
- Pausing automated execution
- Selecting another venue
- Requiring human approval
- Increasing price-impact tolerances only under explicit rules
These controls should be tested against delayed data, missing updates, partial fills, and exchange outages.
Why AI can miss a liquidity gap
Models face several limitations that are especially important in crypto markets.
Displayed liquidity may disappear. Traders can cancel orders before execution, so a snapshot may overstate the size actually available.
Markets are fragmented. Liquidity may be spread across centralized exchanges, decentralized pools, and derivative venues. One venue’s gap may be offset by depth elsewhere, or the venues may fail simultaneously.
Data can be incomplete. Websocket interruptions, timestamp differences, dropped updates, and inconsistent historical feeds can distort both features and labels.
Regimes change. A model trained during a calm period may not understand behavior during a liquidation cascade or protocol incident.
Adversarial behavior is possible. Spoofing, wash trading, coordinated withdrawals, and oracle manipulation can make observable signals misleading. An unusual pattern may be designed to influence the model or other market participants.
Backtests can overstate performance. Historical simulations may assume fills at prices that were not realistically available. They may also ignore fees, latency, queue position, failed transactions, and partial execution.
For these reasons, a model’s alert should be treated as a risk input, not as a guaranteed forecast.
How to evaluate a liquidity-gap model
Before using a model in automated trading or treasury management, evaluate it on questions that match the actual decision.
- Does it detect gaps early enough to change execution?
- Does it measure realized slippage rather than only visual order-book emptiness?
- Does it work across multiple assets and venues?
- How often does it generate false alarms?
- Does performance remain acceptable during volatile periods?
- Are fees, latency, rejected orders, and partial fills included?
- Can operators explain why an alert was triggered?
- What happens when data is delayed or unavailable?
- Does the system distinguish centralized-exchange gaps from DeFi pool risk?
- Are model outputs logged for later review?
Testing should use time-ordered data to avoid accidentally allowing future information into the training set. It should also include stress scenarios that were not used to fit the model.
Conclusion
AI detects crypto liquidity gaps by combining market microstructure data with pattern recognition. It looks beyond the existence of a single empty price range and evaluates depth, spreads, cancellations, trades, volatility, cross-venue differences, pool reserves, and the persistence of those signals.
The strongest implementation is usually layered: deterministic safeguards handle immediate execution risk, anomaly detection finds unusual behavior, and time-series or supervised models add context. Even then, the result is an informed warning rather than a certainty.
For traders, funds, and protocol operators, the most useful question is not whether AI can predict every liquidity event. It is whether the monitoring system can identify deteriorating conditions early enough to reduce order size, change execution, pause automation, or investigate the underlying venue and data before a gap becomes an expensive fill.
You may also like
- Best AI-Powered Social Media Management SaaS Platforms in 2025
- AI Workflows That Replace Entire Departments: The 2026 Blueprint for Lean Operations
- AI SaaS Platforms for Real-Time Business Insights: Unlocking Instant Data-Driven Decisions
- Best AI Portfolio Management Software for Financial Advisors: 2026 Guide
- How Messi Can Lift the FIFA World Cup Once Again: Argentina’s 2026 Title Defense