

- Published on
AI for Crypto Market Breadth Analysis: A Practical Guide
Listen to the full article:
- Authors

- Name
- Jagadish V Gaikwad
What is AI for crypto market breadth analysis?
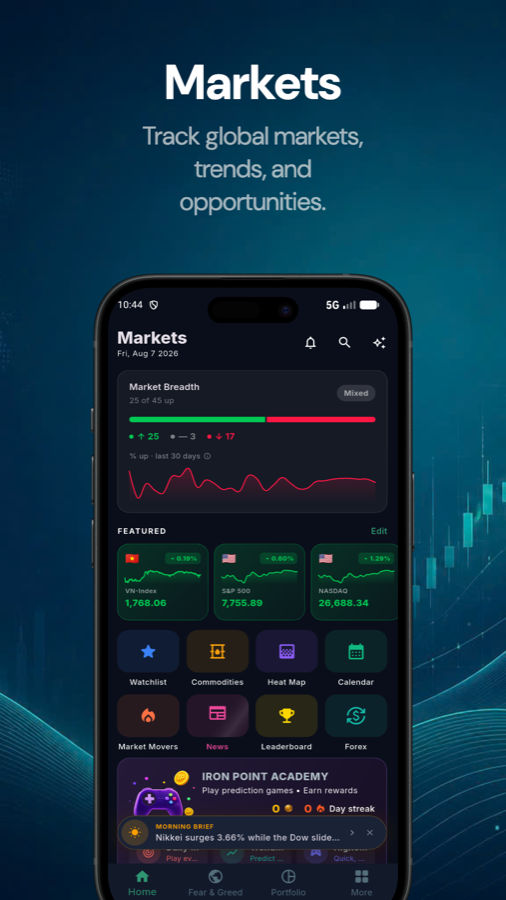
AI for crypto market breadth analysis means using machine-learning systems and automated data workflows to evaluate how widely a crypto market move is distributed across assets, sectors, chains, or exchanges.
Market breadth asks a simple question: Is a market move broad-based, or is it being driven by a small number of large tokens?
A crypto index can rise while most of its constituents decline if Bitcoin, Ether, or a few high-capitalization assets gain enough to outweigh weaker tokens. Breadth analysis exposes that difference by examining participation beneath the headline price move.
AI does not remove the need for sound market data or judgment. Its strongest role is to collect, normalize, classify, and compare large volumes of information faster than a person working manually. Its weakest role is presenting uncertain market relationships as if they were reliable forecasts.
A useful AI workflow therefore treats breadth as a market-health diagnostic, not a guaranteed trading signal.
Why crypto breadth is harder to measure
Traditional equity breadth often relies on a defined list of stocks and relatively stable classifications. Crypto markets are less uniform.
A crypto breadth dataset may contain:
- Thousands of tokens with different liquidity levels
- Multiple versions of the same asset across blockchains
- Wrapped assets and bridged tokens
- Stablecoins that should not be treated like directional investments
- Newly launched tokens with limited price history
- Assets with abnormal or inactive trading volume
- Data from exchanges that use different symbols, timestamps, and methodologies
This creates a data-quality problem before any AI model is used. If the input list contains duplicate assets, stale prices, or unreliable volume, the resulting breadth score may look precise while measuring something else.
The first research task is defining the universe. A broad market universe might include every asset above a minimum liquidity threshold. A narrower universe might include the top 100 assets by market capitalization, excluding stablecoins and wrapped duplicates. Neither choice is universally correct; each answers a different question.
Market-cap rankings and historical crypto market data can be obtained through commercial data providers, but users should read each provider's methodology rather than assuming that similarly named metrics are interchangeable. For example, a price feed, reported volume feed, and on-chain transfer dataset represent different activities.
Core breadth measures AI can calculate
AI is most useful when it converts familiar breadth measures into repeatable, multi-dimensional monitoring.
Advance-decline participation
An advancing asset is one whose price increased during the selected period. A declining asset fell during that period. The advance-decline balance compares the number of gainers with the number of losers.
A simple reading might be:
- More advancing assets than declining assets: participation is positive
- More declining assets than advancing assets: participation is negative
- A narrow difference: participation is mixed
The result depends heavily on the chosen universe and time frame. One hour, one day, and one month can produce conflicting readings without any calculation being wrong.
Percentage of assets above a moving average
A moving average smooths price data over a selected lookback period. Breadth analysts can calculate the share of assets trading above a chosen average, such as a 20-day or 50-day average.
This can help distinguish a market where many assets are participating from one where only a few leaders are strong. AI can track the measure across sectors, chains, or market-cap groups and flag sharp changes.
The indicator is descriptive, not predictive. A high percentage above an average can occur late in an extended rally, while a low percentage can persist during a prolonged decline.
New highs and new lows
Counting assets reaching a recent high or low can reveal whether market leadership is expanding or contracting. AI systems can scan many assets continuously and classify new highs by sector, liquidity, or capitalization.
New-high counts become more informative when combined with volume and liquidity filters. A token reaching a new high on negligible trading activity should not receive the same weight as a liquid asset with broad exchange coverage.
Equal-weighted versus capitalization-weighted performance
A capitalization-weighted index gives larger assets greater influence. An equal-weighted index gives each included asset similar influence.
Comparing the two can reveal concentration. If a capitalization-weighted index rises substantially more than an equal-weighted basket, large assets may be carrying the market. If both move together, participation may be broader.
This comparison is not automatically bullish or bearish. It tells the analyst where performance is concentrated.
Volume participation
Price breadth becomes more useful when paired with trading activity. AI can compare the number of assets rising on increasing volume with the number rising on decreasing volume.
Volume data requires caution because exchange-reported volume may include different instruments, markets, and reporting practices. It can also be distorted by wash trading, fragmented liquidity, or sudden listings. Treat volume as supporting evidence rather than unquestionable ground truth.

How AI improves the workflow
The practical advantage of AI is not that it knows the future. It is that it can make a large, repetitive research process more consistent.
Data cleaning and entity matching
An AI-assisted pipeline can identify similar symbols, detect missing observations, and group assets by chain or sector. Entity matching is particularly important when the same project appears under different tickers across providers.
This process still needs rules and review. An automated system can incorrectly merge unrelated tokens with similar names or treat a wrapped version as an independent asset.
Regime classification
A model can classify market conditions using combinations of breadth, volatility, correlation, volume, and liquidity data. For example, it might label a period as:
- Broad participation
- Narrow leadership
- Defensive or risk-off
- High-volatility rotation
- Low-liquidity or unreliable
These labels are summaries of observed conditions, not objective market regimes discovered without assumptions. The analyst should record which variables produced the classification and how often the model changes its label.
Anomaly detection
Anomaly detection looks for observations that differ sharply from a recent baseline. Examples include a sudden increase in tokens moving together, an unusual divergence between price and volume, or a rapid loss of participation beneath a stable index.
An anomaly is a prompt for investigation, not proof of a trade. It may reflect a genuine market event, a data outage, an exchange issue, or a token-specific development.
Natural-language summaries
A language model can turn a breadth dashboard into a short explanation, such as: “The index is positive, but participation has narrowed because fewer mid-cap assets are advancing.”
That summary is useful only when it is tied to transparent source data. Ask the system to report the observation, comparison period, universe, and limitations. Avoid summaries that use confident terms such as “certain breakout” or “guaranteed reversal.”
A practical AI breadth-analysis process
A repeatable workflow is more valuable than a complicated model.
Define the asset universe. Specify inclusion rules for market capitalization, liquidity, listing age, stablecoins, wrapped assets, and duplicate tokens.
Choose the observation window. Separate intraday, daily, weekly, and monthly breadth. Do not combine them without labeling the result.
Normalize the data. Align timestamps, remove obvious duplicates, document missing data, and record the source and retrieval time.
Calculate several measures. Use advance-decline participation, moving-average participation, new highs and lows, equal-weighted performance, and volume participation.
Segment the market. Compare large-cap, mid-cap, and smaller assets, as well as sectors or blockchain ecosystems where classifications are reliable.
Use AI for comparison and explanation. Ask it to identify changes, clusters, divergences, and anomalies, then show the underlying measurements.
Validate out-of-sample. If a model appears useful, test it on later periods that were not used to design the rules. Avoid changing the model repeatedly until historical results look attractive.
Apply risk controls separately. Breadth analysis does not decide position size, leverage, custody, execution, or maximum loss.
A good prompt for an internal analysis system might ask it to compare the current breadth reading with a defined historical window, list the assets driving the result, identify data gaps, and separate direct observations from interpretations.
Comparing common AI approaches
| Approach | Best use | Main strength | Main risk |
|---|---|---|---|
| Rule-based dashboard | Routine monitoring | Transparent and easy to audit | Misses complex relationships |
| Statistical anomaly detection | Finding unusual participation changes | Highlights deviations from a baseline | Sensitive to changing volatility and bad data |
| Machine-learning classifier | Grouping market conditions | Combines many variables | Labels can be unstable or overfit |
| Language model summary | Explaining dashboard output | Fast, readable synthesis | May invent explanations unless grounded in data |
| Automated trading model | Executing a predefined strategy | Consistent execution | Adds model, execution, liquidity, and operational risk |
The most defensible setup often combines these approaches: explicit breadth calculations, statistical checks, and a language model used only as a controlled explanation layer.
Important limitations and failure modes
Survivorship bias
If an analysis uses only tokens that exist today, it may exclude assets that failed, became inactive, or were delisted. Historical results can therefore look stronger than a realistic historical universe.
Maintain dated constituent lists when possible. If that is not possible, state that the analysis uses a current-universe approximation.
Look-ahead bias
A model must not use information that was unavailable at the time of a historical decision. Future constituent rankings, revised classifications, or later data corrections can quietly contaminate backtests.
Store the timestamp and version of each input. This is more important than adding another model layer.
Liquidity and execution
A broad signal can identify many advancing tokens without proving that a portfolio could buy them at the displayed price. Slippage, spread, market depth, network fees, and exchange limits can materially change results.
Reported prices are observations. Executable prices depend on order size and venue conditions.
Correlation changes
Crypto assets can appear diversified while moving together during stress. Sector labels do not eliminate common exposure to market-wide liquidity, Bitcoin dominance, stablecoin conditions, or macroeconomic events.
AI may detect changing correlations, but it cannot guarantee that a historical relationship will continue.
False explanations
A model may correctly identify that breadth weakened and incorrectly explain why. It might attribute the change to news, institutional flows, or a protocol event without reliable evidence.
Require citations or source fields for causal claims. If no verified cause exists, the output should say that the cause is unknown.
How to evaluate an AI breadth tool
Before relying on a product or internal system, ask:
- What assets and venues supply the data?
- How are stablecoins, wrapped assets, and duplicates handled?
- Is reported volume filtered or independently validated?
- Are historical constituent lists preserved?
- Can every alert be traced to the underlying observations?
- Does the system distinguish correlation from causation?
- Are backtests separated from the period used to build the model?
- Does it disclose fees, slippage, and liquidity assumptions?
- Can the user export raw data and calculation rules?
- What happens when an API fails or data arrives late?
A polished interface is not evidence of analytical quality. Reproducibility, documented methodology, and clear uncertainty matter more.
Security and fraud warnings
Claims about “AI-powered crypto signals” deserve special scrutiny. Regulators have warned that fraudsters use AI terminology, realistic websites, social media, messaging groups, and fabricated performance claims to attract investors. The SEC, NASAA, and FINRA investor alert on AI-related investment fraud specifically warns that emerging technology can be used as a lure.
Crypto-specific scams may also claim that bots or AI systems generate guaranteed profits. The SEC investor alert on crypto asset investment scams advises caution around such claims. A 2026 SEC enforcement announcement described alleged schemes involving supposed AI-generated trading signals, fake platforms, and demands for advance fees.SEC enforcement announcement
No breadth dashboard can verify that a custodian, exchange, fund, or signal seller is legitimate. Verify the provider independently, avoid sending funds to platforms promoted only through private groups, and treat guaranteed returns as a warning sign.
A sensible decision framework
Use AI for crypto market breadth analysis when the task involves large datasets, repeated comparisons, transparent calculations, and alerting.
Use extra caution when the system:
- Produces a single unexplained buy or sell answer
- Hides the asset universe or data sources
- Uses unverifiable performance screenshots
- Claims to predict sudden market moves consistently
- Encourages leverage or immediate deposits
- Cannot show how an alert was calculated
The strongest interpretation is usually comparative: participation is expanding or narrowing, leadership is concentrated or distributed, and the observation is supported or weakened by volume and liquidity data.
That interpretation can improve research discipline without pretending that uncertainty has disappeared.
Conclusion
AI for crypto market breadth analysis is most valuable as a structured way to measure participation across a difficult, fragmented market. It can clean data, compare market segments, detect unusual changes, and explain dashboards more efficiently than manual review.
Its output remains dependent on the asset universe, data quality, time frame, methodology, and validation process. Breadth can reveal whether a market move is broad or narrow, but it cannot guarantee direction, causation, execution quality, or profit.
The practical standard is simple: define the universe, preserve the data trail, combine several breadth measures, test without look-ahead bias, and treat AI-generated explanations as hypotheses to verify. That approach makes the technology useful while keeping its limitations visible.
You may also like
- How AI Is Transforming KYC and AML Compliance in 2026
- Multi-Cloud Hosting: Benefits and Challenges for SaaS Startups in 2025
- AI-Powered Blockchain Analytics: Tools and Use Cases for 2026
- The Rise of Autonomous SaaS Applications: How AI-Native Apps Are Rewriting Software in 2026
- Google Pixel: The Fastest Growing Premium Smartphone Brand in the World in 2025